This post describes my recent work on Jetstream as part of my day job at Mozilla. In particular, I’ll describe how Argo and Dask were used to scale up a system that processes data of dozens of different Firefox experiments daily and on-demand. This work has been co-developed with my colleague Tim Smith.
Beginning of 2020 the development of a new experiment analysis infrastructure was launched at Mozilla to help to scale up the number of experiments done in Firefox and reduce the involvement of data scientists necessary for each experiment. The entire infrastructure consists of different components and services, with Jetstream being the component that automatically analyses collected telemetry data of clients enrolled in experiments.
As the number of experiments started to increase, running the daily analyses started to take very long as some experiments require processing an extensive amount of data. In some cases, completing the experiment analyses for a single day took over 23 hours. To provide analysis results without significant delay and speed up the entire analysis process, it was time to make some architectural changes and parallelize Jetstream’s experiment analysis. Argo turned out to be ideal for parallelizing the analysis on a higher level and in combination with Dask for parallelizing lower-level calculations, we were able to significantly reduce the analysis runtime.
Background: Jetstream
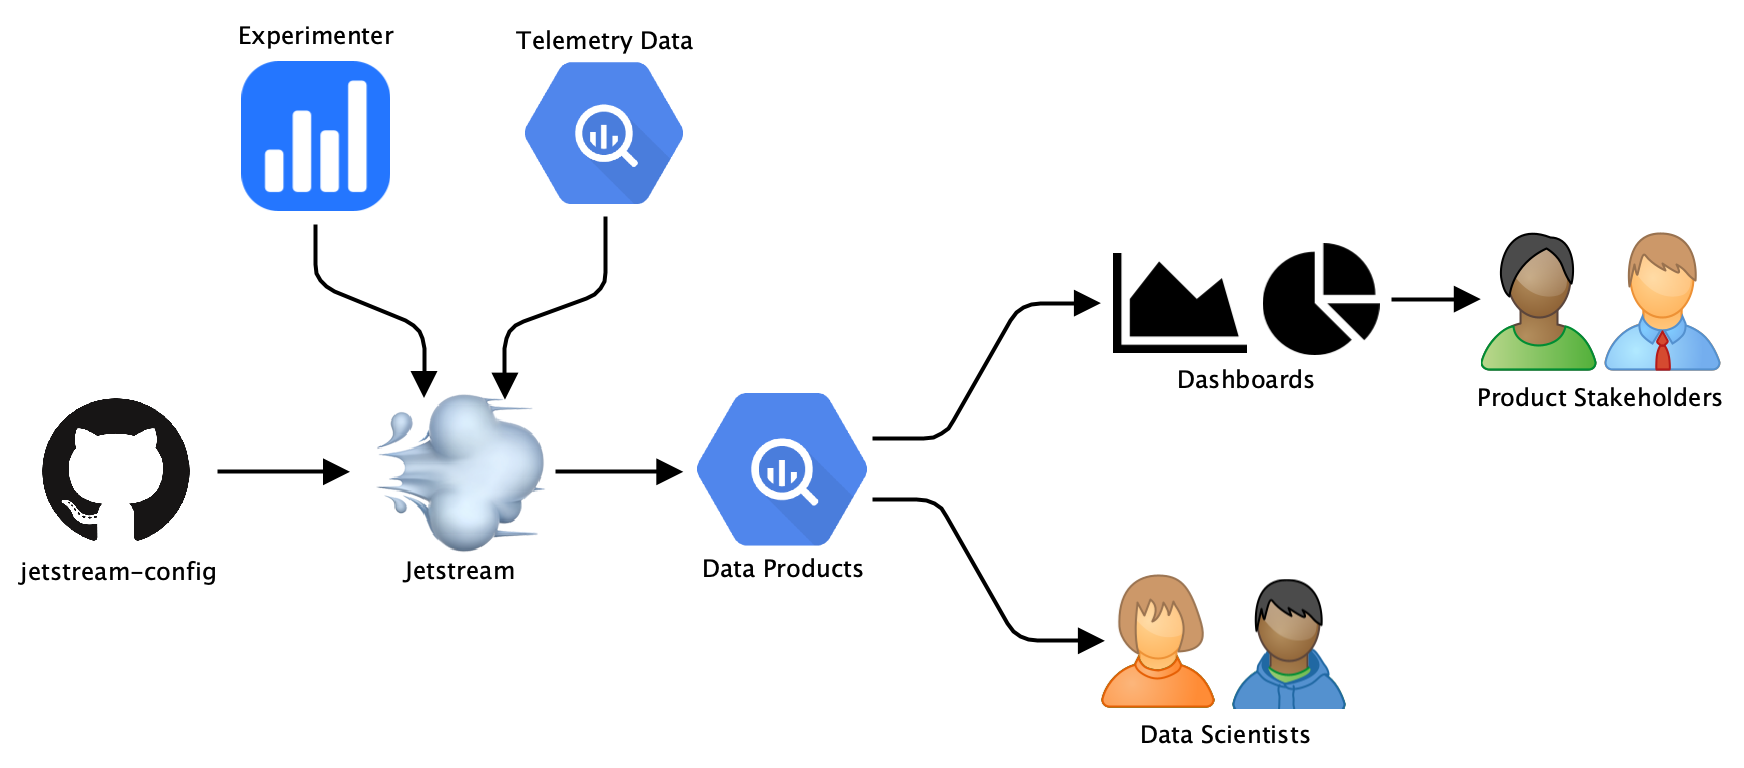
 Jetstream overview.
At Mozilla, experiments are managed by the Experimenter service and delivered to Firefox clients via Normandy. Product stakeholders and data scientists are interested in how specific metrics, such as the number of hours Firefox has been used or the number of searches done, are affected by these experiments. Jetstream is scheduled in Airflow to calculate specific metrics and apply statistical treatments to collected experiment telemetry data for different analysis windows. Our telemetry data as well as all of the generated data artefacts are stored in BigQuery.
The generated data artefacts are visualized in dashboards that allow stakeholders to see results and changes. Data scientists have direct access to the datasets generated by Jetstream to allow for custom analysis. For calculating metrics and statistics Jetstream uses the mozanalysis library Python library. While there are a few pre-defined metrics and statistics that are calculated for every experiment, it is also possible to provide custom configurations with additional metrics and statistics. These configurations are stored in the jetstream-config repository and automatically detected and applied by Jetstream.
During analysis, the following steps are executed for each experiment:

First, the default configuration and, if defined, a custom configuration provided via the jetstream-config repository are parsed and used for analysis. The experiment definition and config parameters are used to run some checks to determine if the experiment can be analyzed. These checks include, for example, validating start dates, end dates and enrollment periods.
If the experiment is valid, then metrics are calculated for each analysis period (daily, weekly, overall) and written to BigQuery. Metrics are either specified as SQL snippets or a reference to existing metrics defined in mozanalysis is provided in the configuration files. Next, for each segment, first, pre-treatments are applied to the metrics data which is then used to calculate statistics. Statistics data is written to BigQuery and later exported to GCS as JSON which will be used for displaying results in dashboards.
Initially, Jetstream was set up to run on Airflow, constraining it to a single slot with a limited amount of memory available which was limiting the analysis speed. For each of these experiments, up to 12 GB of memory are required to calculate statistics. As the number of experiments analyses per day increased simply running the analyses of these experiments in a single Kubernetes pod was not performant anymore. Some days, the analysis took over 23 hours. As Airflow does not support creating tasks dynamically during runtime, it was not possible to create separate tasks for each experiment analysis. A different approach was needed.
Parallelizing experiment analyses using Argo
After some research and trying out different approaches, Argo turned out to be perfect for distributing analyses for different experiments. Argo is a light-weight workflow engine for orchestrating parallel jobs on Kubernetes and is capable of creating tasks dynamically that will be executed in parallel. Using Argo, the analyses of different experiments can be split into separate jobs that run in parallel.
The setup was quite straightforward: a Kubernetes cluster needed to be set up and Argo was installed on the cluster by following the installation guide. When creating the cluster, BigQuery and Compute Engine read/write permissions needed to be enabled to ensure pods have sufficient access to telemetry data and can submit Argo workflows.
Workflows are one of the core Argo concepts and define what is being executed. They are written as yaml and generally consist of an entry point and a list of templates defining the work to be done in each step.
The workflow spec that is used for the experiment analysis in Jetstream is shown in the following:
apiVersion: argoproj.io/v1alpha1
kind: Workflow
metadata:
  generateName: jetstream-
spec:
  entrypoint: jetstream
  arguments:
    parameters:
    - name: experiments  # set dynamically by jetstream when workflow gets deployed
    - name: project_id
    - name: dataset_id
  templates:
  - name: jetstream
    parallelism: 5  # run up to 5 containers in parallel at the same time
    inputs:
      parameters:
        - name: experiments
    steps:
    - - name: analyse-experiment
        template: analyse-experiment
        arguments:
          parameters:
          - name: slug
            value: "{{item.slug}}"
          - name: date
            value: "{{item.date}}"
        withParam: "{{inputs.parameters.experiments}}"  # process these experiments
        continueOn:
          failed: true
    - - name: export-statistics
        template: export-statistics
        arguments:
          parameters:
          - name: slug
            value: "{{item.slug}}"
        withParam: "{{inputs.parameters.experiments}}"

  - name: analyse-experiment
    inputs:
      parameters:
      - name: date
      - name: slug
    container:
      image: gcr.io/moz-fx-data-experiments/jetstream:latest
      command: [
        bin/entrypoint, run, "--date={{inputs.parameters.date}}",
        "--experiment_slug={{inputs.parameters.slug}}",
        "--dataset_id={{workflow.parameters.dataset_id}}",
        "--project_id={{workflow.parameters.project_id}}"
      ]
      resources:
        requests:
          memory: 10Gi   # make sure there is at least 10Gb of memory available for the task
        limits:
          cpu: 4  # limit to 4 cores
    retryStrategy:
      limit: 3  # execute a container max. 3x
      retryPolicy: "Always"
      backoff:
        duration: "1m"
        factor: 2
        maxDuration: "5m"

  - name: export-statistics
    inputs:
      parameters:
        - name: slug
    container:
      image: gcr.io/moz-fx-data-experiments/jetstream:latest
      command: [
        bin/entrypoint, export-statistics-to-json,
        "--dataset_id={{workflow.parameters.dataset_id}}",
        "--project_id={{workflow.parameters.project_id}}",
        "--experiment_slug={{inputs.parameters.slug}}"
      ]
When Jetstream runs its daily analyses, it fetches all active experiments from Experimenter and injects these experiments as parameter into the workflow spec before the workflow is submitted. Each experiment is a tuple consisting of a unique experiment identifier (slug) and a date for which data should be processed. The GCP project name and destination dataset in BigQuery where data should be written to need to be specified as parameters as well.
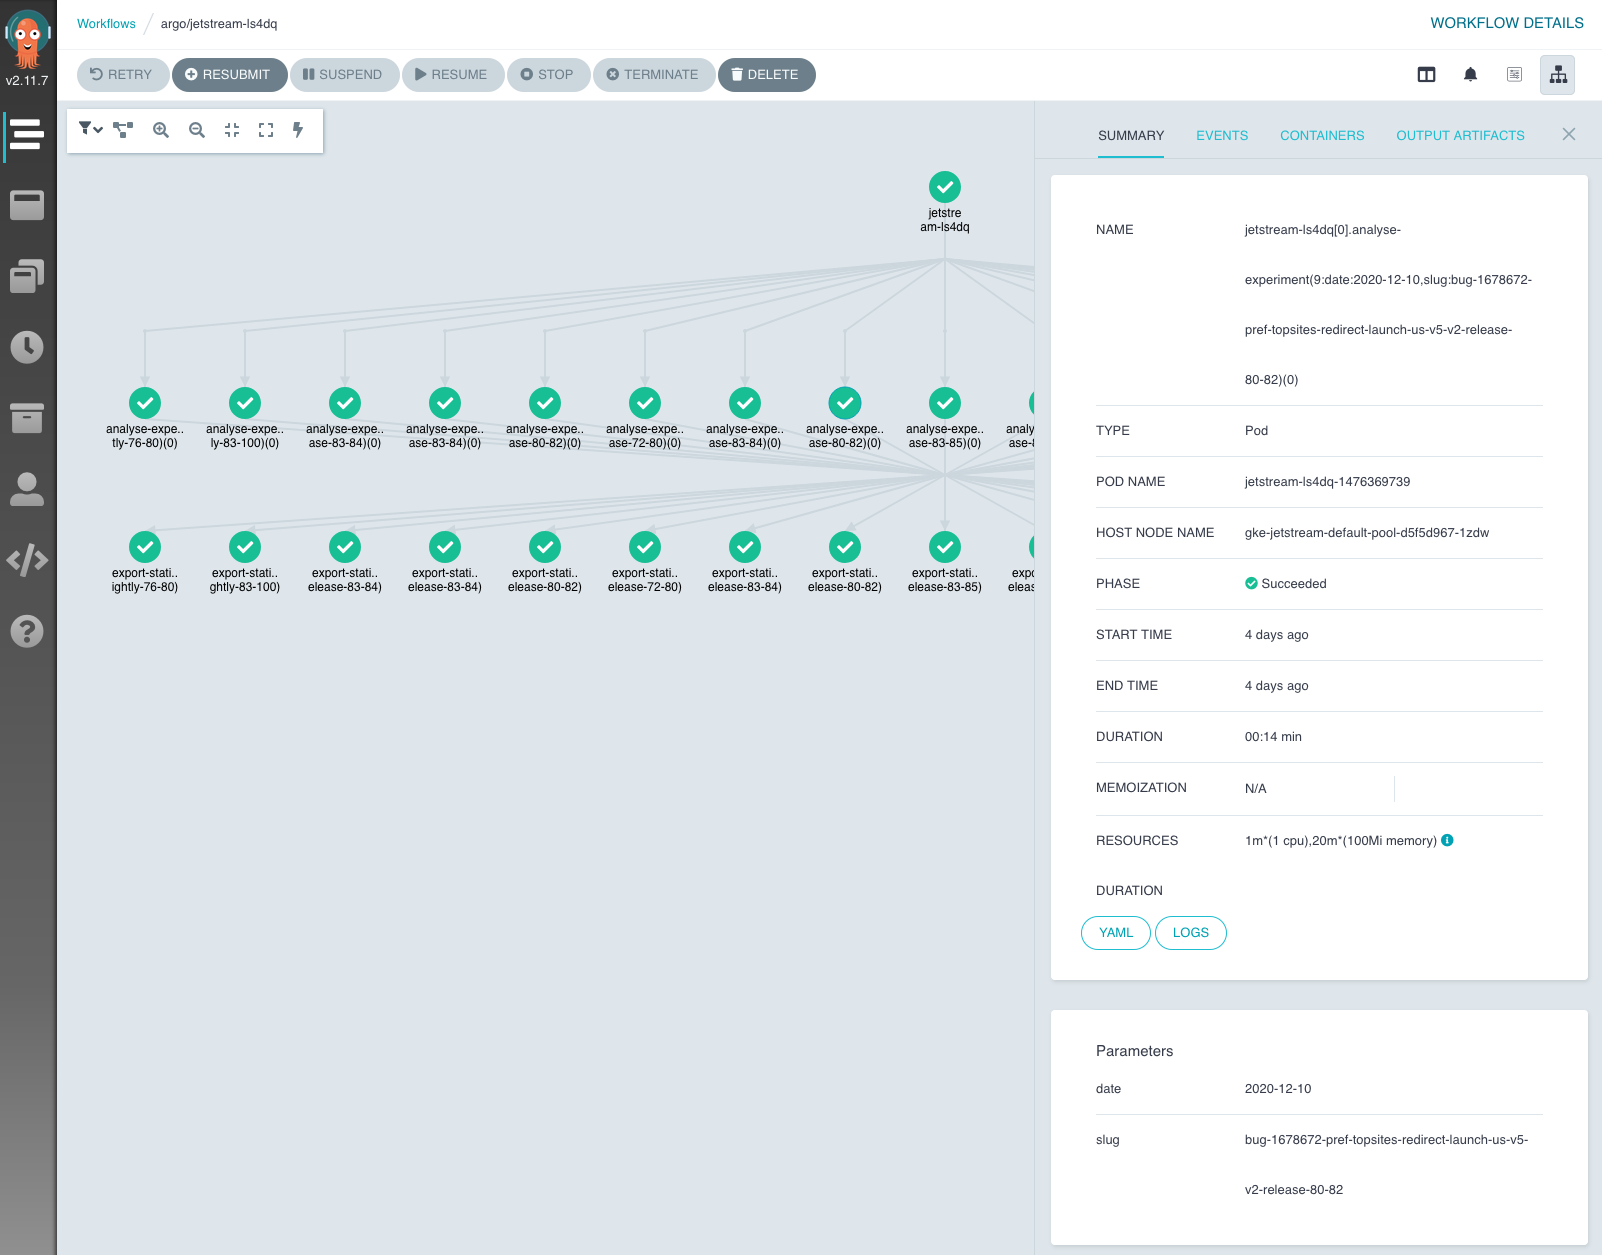
The workflow spec defines two steps that are executed for each experiment and date: analyse-experiment and export-statistics. In the analyse-experiment metrics and statistics are calculated and written to BigQuery. export-statistics exports all statistics data that has been written to BigQuery as JSON to GCS to make it available to our dashboard tools. Running these steps for each experiment will be done in parallel. Jetstream provides an entry point script that allows specifying what the Jetstream container should execute. The run and export-statistics-to-json commands are used by the steps defined in the spec.
Up to 5 experiment analyses will get executed in parallel. This is to ensure available cluster resources aren’t exceeded when too many experiments need to be analysed at the same time. The spec also allows managing Kubernetes resources. For the analyse-experiment step, which is potentially quite compute- and memory-usage intensive, the spec ensures that the container has at least 10 Gb of memory available and up to 4 CPU cores. Also, if the step happens to fail, the specified retryStrategy ensures that the container will get executed up to 3 times.
As the workflow parameters might change between runs, Jetstream injects them into the workflow spec right before it submits the workflow to Argo. For submitting workflows to Argo, we use the argo-client-python library.
In addition to daily analysis runs, Jetstream also needs to support running analyses on-demand. When a config in jetstream-config changes or a new one is added, all analyses of the affected experiment starting from the time it had been launched need to be re-executed. The defined workflow also supports this use case. Instead of having a list of tuples consisting of different experiment slugs with the same analysis as parameter, Jetstream will inject a list of tuples with the experiment slug of the targeted experiment and dates ranging from the start of the experiment until the current date or the end of the experiment.
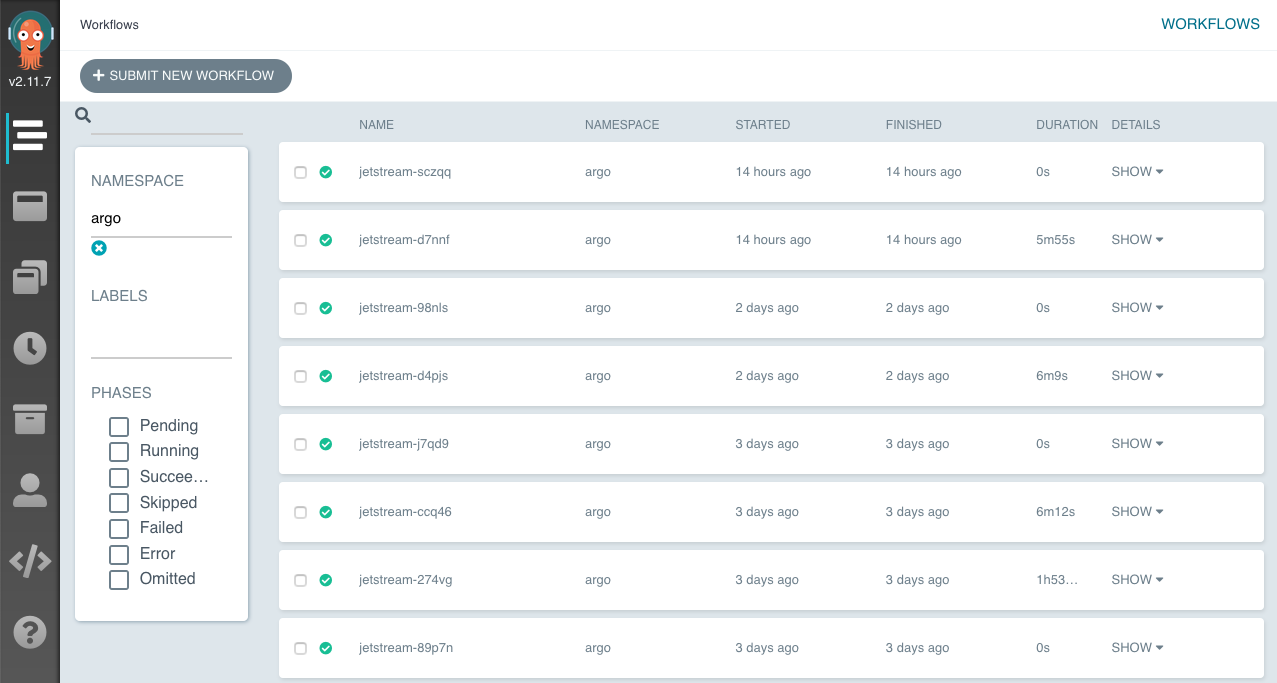
Argo provides a neat dashboard for monitoring workflows which is also very useful for debugging. Accessing the dashboard locally requires forwarding the port of the pod running the Argo Server.
 Argo Dashboard.
For each workflow, live statuses of its jobs are available with additional information about job parameters, duration and resource usages. For each job, logs can be directly accessed through the dashboard. This notably improved debugging workflows and experiments where analysis failed.
 Workflow in the Argo Dashboard.
Using Argo, we were able to run the analyses for days with a lot of experiments up to 3x faster than before. We are still tweaking configuration parameters, such as the number of pods running in parallel, to increase the speed even further.
Parallelizing lower-level calculations using Dask
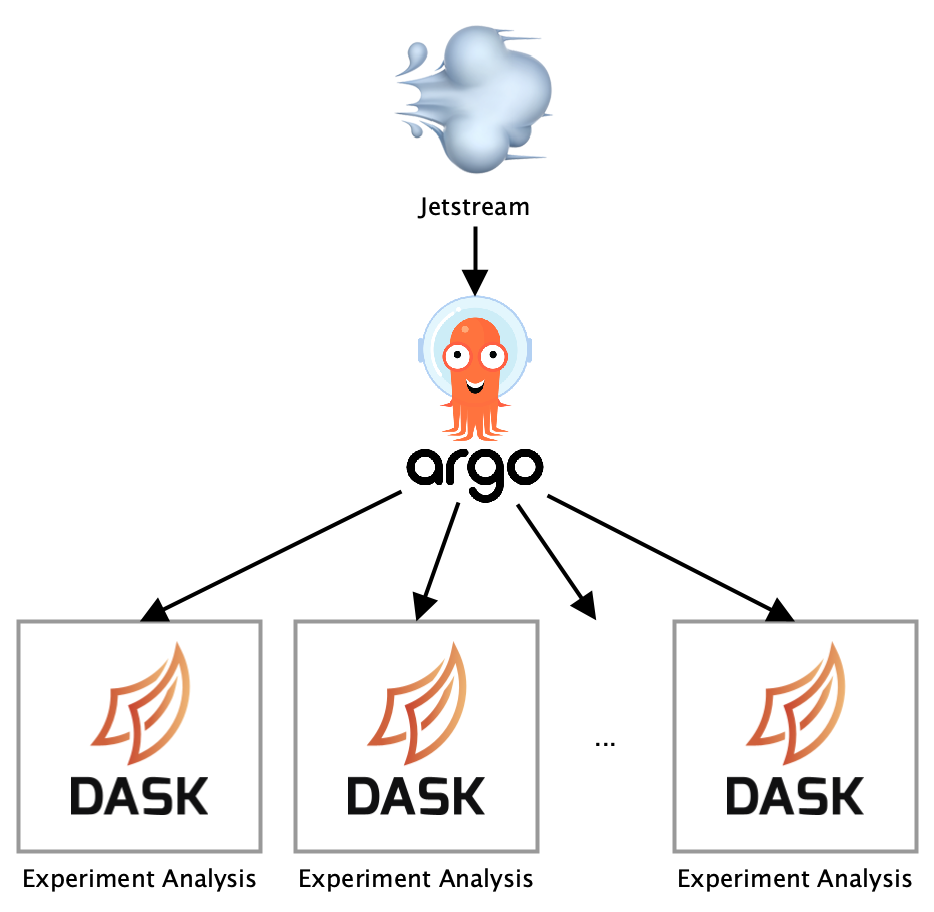
Besides running analyses in parallel, the steps executed during analysis for each experiment also consisted of tasks that could be parallelized. Jetstream calculates for each analysis period (daily, weekly, and overall) specific statistics for a set of segments. To parallelize these lower-level calculations, we decided to use the Dask Python library. Dask allows representing complex application logic as tasks in a graph that are executed in parallel on multiple cores.
The dask.delayed interface is used to turn the functions executing these steps into tasks that are added to a task graph which executes these steps in parallel. Dask is configured to use as many cores as are available on the machine by default, with 1 worker for each core. Multi-threading is being avoided, instead, processes are used since the code is dominated by Python code, otherwise there wouldn’t be any speedup due to Python’s Global Interpreter Lock.
Adding Dask required some changes to Jetstreams initial codebase. The main changes consisted of re-writing the analysis functions without nesting since nested Dask workflows are not supported and resolving some pickling errors.
Using Dask reduced the runtime by half for compute-intensive experiments.
Conclusions

Overall, integrating Argo and Dask into our existing Jetstream codebase did not require a whole lot of changes. Most of the code stayed the same as before which made the process of speeding up our automated experiment analysis infrastructure a fast one. Currently, analyses complete up to 6x faster compared to our original setup.
There is still some room for improvement in finding the best configuration parameters that might result in an even larger speedup. Additional speedup could be achieved by using Dask Kubernetes which deploys Dask workers on the cluster instead of just the single pod running the analysis for an experiment. The setup for Dask Kubernetes turned out to be relatively complicated, but it might be something worth investigating with an increasing number of experiments in the future.