I have always been curious about how I spent my time. All the things I did in the past tell me my story about growth, progress and what I have learned over time.
Having had various spreadsheets, a Trello board and paper-based systems over the years for planning out what I wanted to do and logging what I did in the past, I was never able to maintain any of these approaches over a longer period. A few years ago, I came up with a calendar-based system that has been working well for me ever since and fulfils all my requirements:
- Tracking time needs to be as convenient as possible (this is very subjective, of course), adding an activity should only be a matter of seconds.
- The interface for tracking needs to be as simple as possible, I don’t need a lot of fancy features I will never use.
- I don’t want to have to use some 3rd-party app (that might not be developed anymore in the future, is only available for specific platforms, …)
- I need to be able to track time from pretty much any device, like my phone or laptop.
- I want to have an API to access tracked data and run some analysis on it, like developing a dashboard.
Calendars have been around since the dawn of time. I use multiple Google Calendars to manage meetings, appointments or any upcoming events that I need to remember. Any platform allows to integrate Google Calendars and provides applications to add, edit and view events, often the user interfaces are very simple to use. Google Calendar also offers an API to pull event data from. Calendars seemed like the perfect tool for developing a time-tracking system.
How I Track My Time
The time-tracking system I ended up implementing is as follows:
- Categories: I have multiple calendars which are used to group activities into broad, high-level categories. For me, such categories are, for example, Meetings, Focused Work, Social, Sleep, …
- Areas: Each event/activity that gets added to a calendar is tagged with a specific area. Areas usually refer to specific projects or efforts. Multiple activities are or will be performed in an area.
- Activities: Each event represents a specific activity that happened over the specified time frame. Ideally, a short description of what that activity entailed is provided, but for me, this is optional (in the majority of cases I do provide one, but not always).
The area and activity description are both provided in the event title. The format that has worked for me was to separate the area tag from the description with -, which results in the events having <area> - <description> as titles. The following illustrates what entering activities into multiple calendars for various areas could look like:
![]()
For the most part, I enter activity data through the standard Calendar app that comes with macOS. When working on my laptop I have additional monitors of which one has the Calendars app open at all times, so I can quickly add a new activity. Some other nice features are that events get auto-completed and the drag-and-drop way of editing events makes the user experience very pleasant. By default, the lowest resolution for events is 15-minute increments. This has not been an issue for me, most activities take more than 10 minutes for me. If I work on multiple shorter tasks, for example, then I try grouping them instead of tracking each task individually.
Getting Insights
I recently set up a dashboard that pulls in the activity data from the Google Calendar API and visualizes it:
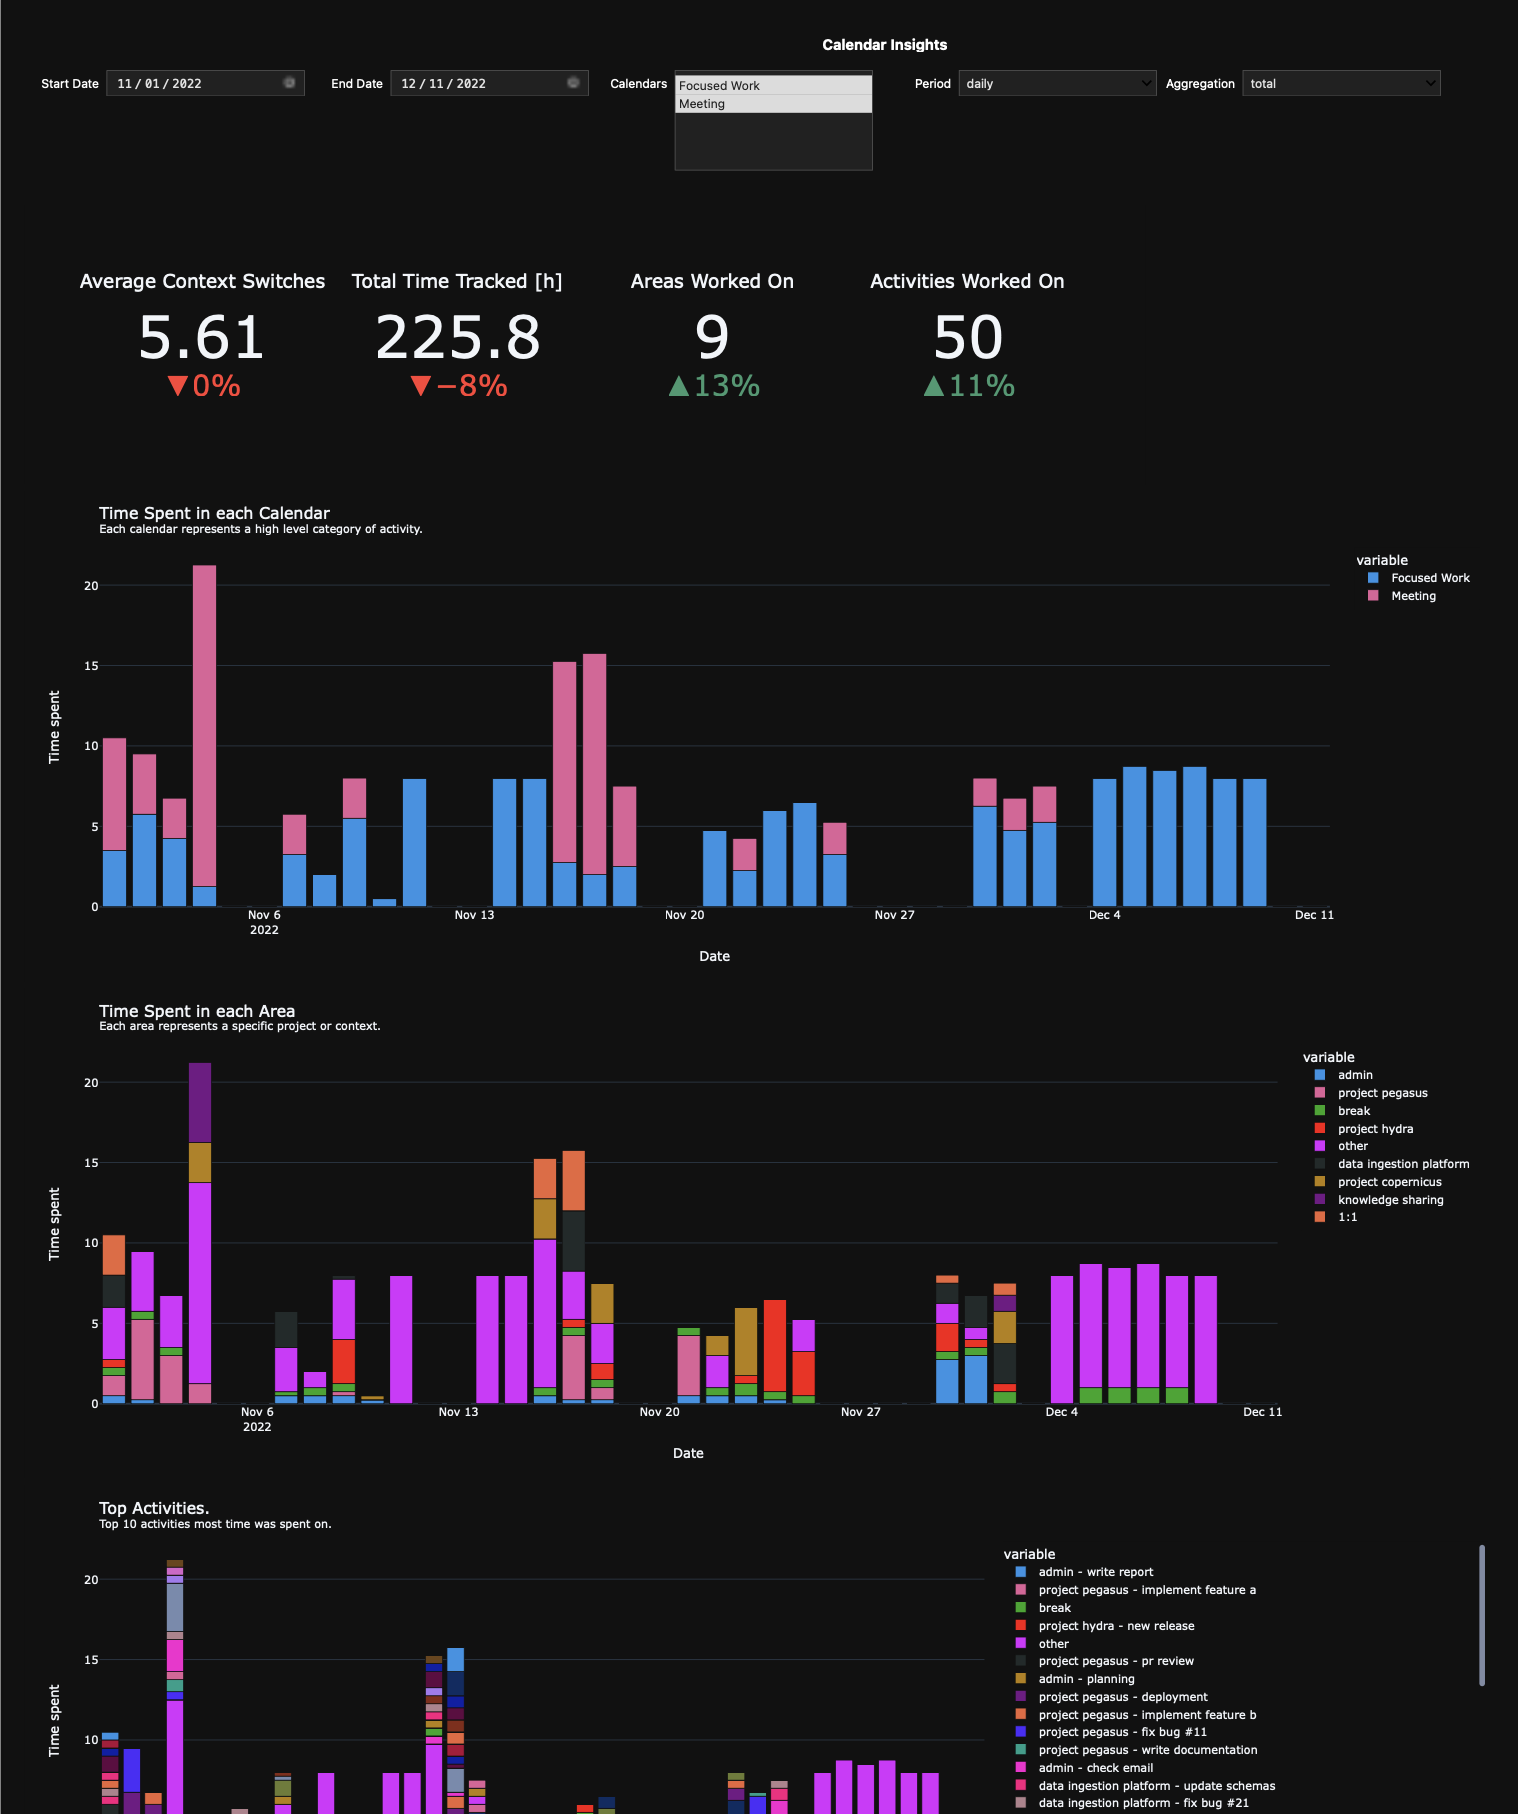
Everything is based on a Jupyter notebook which gets transformed into an interactive dashboard using Voilà. The dashboard can run locally or could be hosted on a server or a raspberry pi using Docker. All code is available in the calendar-statistics Github repository. The code is designed to be extendable to add more custom analyses and graphs.
The dashboard allows filtering the date range to analyse and specify which calendars should be visualized. It also offers to specify into what periods data should be aggregated. These periods are daily (show data for each day), weekly (show data for each week, from Monday to Sunday as a single data point) and overall (one data point that represents the entire selected period). Another option the dashboard provides is to switch between showing absolute, and total values and percentages.
The dashboard shows some status indicators of selected key metrics at the top. These indicators show a delta compared to the previous time period. If the date filters are set to show only data from the current month, then these deltas will indicate how the metric values changed compared to the month prior.
Graphs that are part of the dashboard by default help in answering some of the following questions:
- How much time was spent on each category?
- What activities were most time spent on?
- How many context switches occur in a given time period?
- What fraction of time was spent in certain areas?
- When did most context switches occur?
- …
All of the graphs are interactive. It is possible to only select certain “variables” and hide others to get a better insight.
Final Thoughts
I have been using this system for almost 3 years now and it has been working very well for me. It did help me in being more aware of how I spend my time and just going through the data is incredibly fascinating!
Initially, I started out tracking pretty much all of my time, work and personal time. However, I could keep up with this for a few months only and stopped tracking most of my free time. Pulling out your phone and entering all of the things that happened every day did add too much of an inconvenience. It is much easier to track anything work-related since I’m just sitting in front of my laptop and monitors with the Calendar app open right there. So most of my tracked activity time is work-related, which still amounts to ~8 hours or more daily.
This system also helped me tremendously to plan what I want to get done ahead of time. I often just enter activities for the thing I know need to get done a day or two ahead of time. If my estimates are wrong or priorities change then editing these existing events is still super easy. But having them show up in my calendar already makes it more likely that I will do them.
Having pretty accurate insights into my work activities has helped me in answering questions my manager might have (How much time do you spend in meetings? What amount of time do you spend on project XYZ? …). It is also a huge help when writing half-yearly self-reviews which always ask about what we have been doing over the past half-year.
Personally, I find it quite rewarding and the effort (at least to me) is minimal.